
A large volume of timestamp data is a reality, this is common when we are dealing with networked devices. Typically a network of devices generate a large number of alerts. Mining of alert dataset provides insights about the network .
Recently, I came across a situation where a business user was looking for a multidimensional visualization of timestamp data. Data was about a network of thousand plus devices and alarms generated from the devices about the status of the network – alarm transaction of few million records spread over six months and each record has a timestamp. His primary questions was :
1. Do we see a bunch of alarms during a specific time of the day.
2. Is this trend is consistent across months and/or a pattern exists by the days of the month.
First step would be to create few visualization, then probably few measures around the questions to accept or reject hypotheses conjectured earlier. What he was looking for – a better description of the alarm patterns and linking with time, months and days. As usual there could many approaches – we can have multiple ways of slicing the data and generate a large number of visualization etc.
The aggregated data in this case – 4,320 records divided into 3 dimensions – month, day and hour.
The dataset in question can be structured in two ways – 1. series of 4,320 data points or 2. 2D Array of 4,230 cells. Without much details we can say single bar and/or line makes a little sense here, if we make multiple bar or charts we may miss the interrelation between the months, days and hours.
First solution was a modified heat map as below:
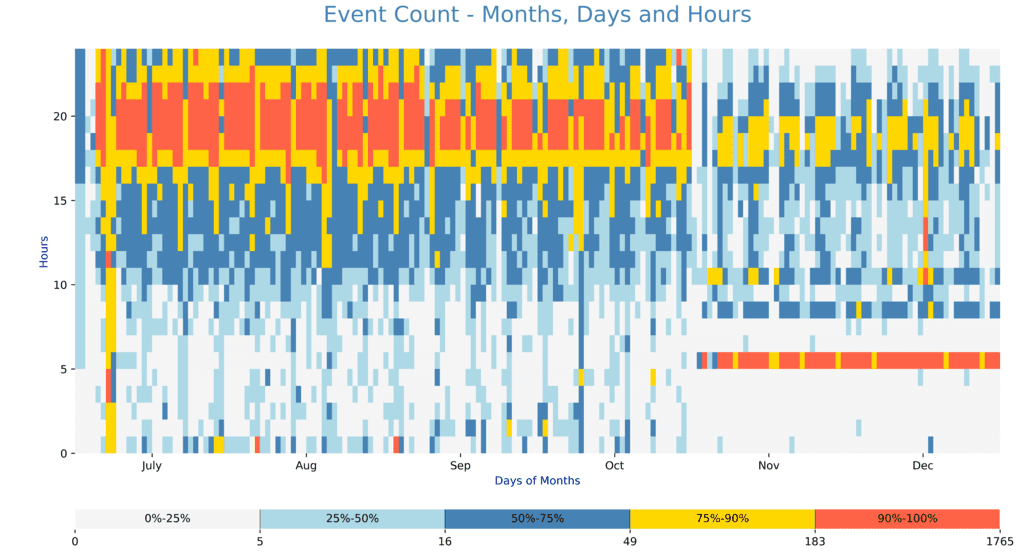
A matrix of month-days X hour with cell values being color coded as per the percentile buckets of the values. This picture provides a very high level view of the distribution of the events. In addition from the picture we cannot make out which is the exact time-hour when we the see the increased activity in the network. So we can conclude that we need more granular view of the situation.
I was looking for a better solution, finally with some secondary research, SO and others, developed a solution which can be thought as visualization of data in circular coordinate system.
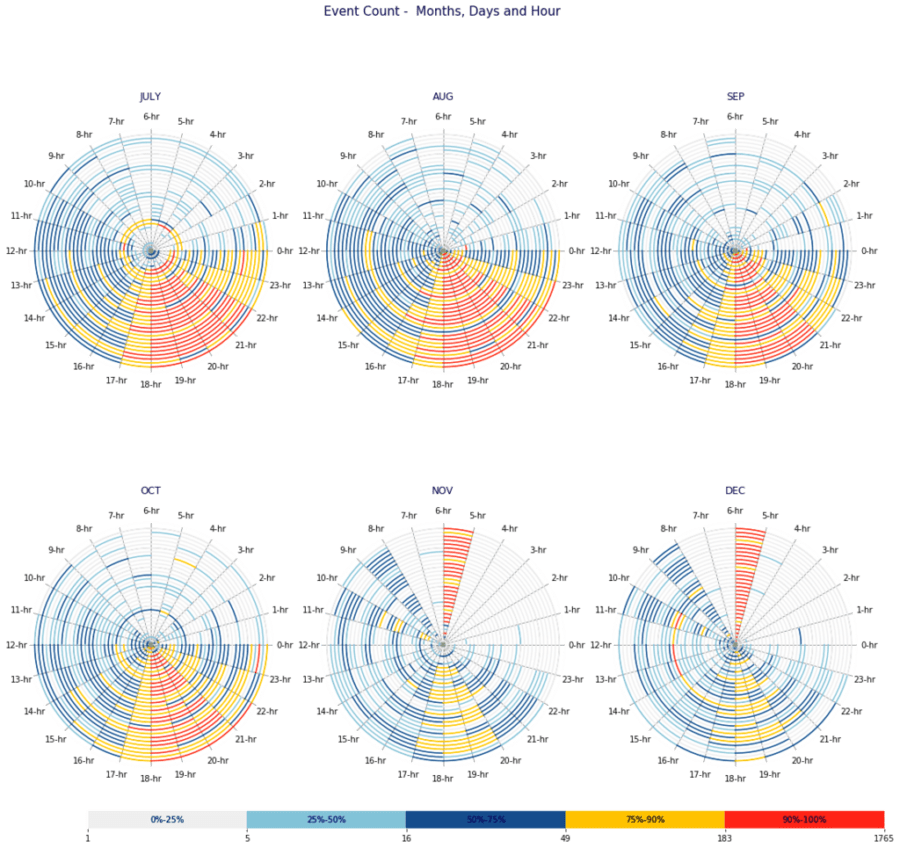
In the above diagram, a single (thirty days) month has been represented by a collection of thirty concentric circles. Each circle has been divided into 24 arcs , with specific arc representing a particular time hour – the values of signals has been color coded as per the specific scale. If we pick a specific disc and a specific arc it would tell us – distribution of signals for a 30 days period for that specific hour. In my opinion, this granular view is a really a good visualization for the questions above.
Matplotlib has good facility of plotting in polar coordinate system – demo page few examples. Plot above is a collection of line charts in polar coordinate system. For a specific data tuple – (day, hour and value), has been converted into – rθj, rθk ,… rθp, color-code ,subsequently, plotting a line base on this conversion. This would be repeated for 4,320 data points.
Finally, polar coordinate based visualization could be useful in specific situations, for timestamp data it could all the more useful. The original mathematical approach is here