
INTRODUCTION TO THE RESEARCH QUESTION
The research was conducted to find out what price maximises profit without sacrificing the high demand for the product due to the price being too high nor sacrificing the margins on the product due to the price being too low.
The goal is to experiment with different price levels for the same product in one market place and country to see how sales volumes change with prices and which volume level of products we can be sold for that optimal price range.
As a data scientist it is my responsibility to identify the optimum prices of products so the items can be sold for maximum profit.
Sales managers and small business owners are faced with the decision of at what price to sell each of their products in each marketplace or country in order to be able to maximize profit. With each line of product being added and a lot of products to monitor, it is very difficult to determine the optimum price for each product. Using proper analytic and research methods to determine the optimal price for each product will help the small business owners and large companies to generate more sales and revenue at the optimum price
METHODS
The sample included N = 262 individual orders for Interlocking Hearts Design Cake Knife/Server set with OrderItemSKU as 2401 from the period ranging from 1st March 2014 to 20th April 2016 with an ecommerce company which sells on Amazon.co.uk
The Profit response variable is measured as the product sale price on amazon.co.uk which includes amazon.co.uk commission and any applicable postage costs less the purchase price of the Hearts Design Cake Knife/Server set from the supplier.
Predictors included:
i) Isweekday – Whether item was sold on a WEEKDAY or not
ii) Isweekend – Whether item was sold on a WEEKEND or not
iii) Isworkday – Whether item was sold on a WORKDAY or not
iv) IsBankHoliday – Whether item was sold on a BANK HOLIDAY or not
v) OrderItemQuantity – total quantity of items bought in one single sale from a customer
vi) ProductSalePrice – total amount a customer pays for one single checkout purchase
vii) SupPurchasePrice – Amount paid to supplier as cost price for the product
Analysis
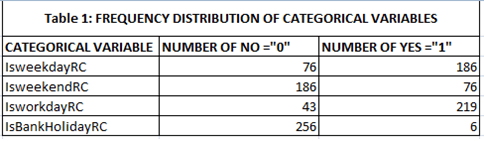
The distributions for the predictors and the profit response variable were evaluated by examining frequency tables for categorical variables and calculating the mean, standard deviation and minimum and maximum values for quantitative variables. The YES and NO values of the categorical predictor variables; Is Weekday, Is Weekend, Is Workday, and Is Bank Holiday were recoded to “0” and “1” where “0” means No and “1” means YES.
Where there were duplicate order numbers which happened in one instance, only one observation was chosen for the analysis. Also all profit figures were considered positive figures. Where there were some negative profit figures in the data, I took the absolute figures of them to obtain only positive values (just for experiment purposes as the data size is too small).
Scatter plot was generated for the relationship between the profit and product sale price.
Decision tree (Regression Tree ) was used to classify the Product Sale Price which resulted in the many numbers of profits at each sale retaining the best possible sales and profits at the same time. A cross-validation test was run where the data was split into 60% (N = 157.2) for the training data and 40% for the test data (N = 104.8). A Confusion Matrix was used to estimate the prediction accuracy of my model. And finally a Test Accuracy score was run to see the model accuracy.
RESULTS
Table 1 below shoes the frequency distribution of the categorical predictor variables Is Weekday, Is Weekend, Is Workday, and Is Bank Holiday.
Below are the histograms for the all predictor variables relative to the Profit of the Interlocking Hearts Design Cake Knife/Server set product.
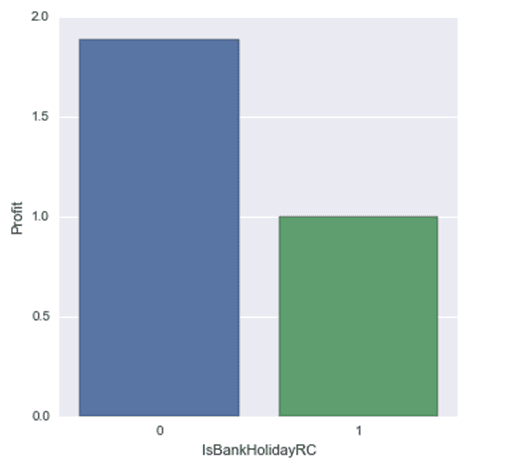
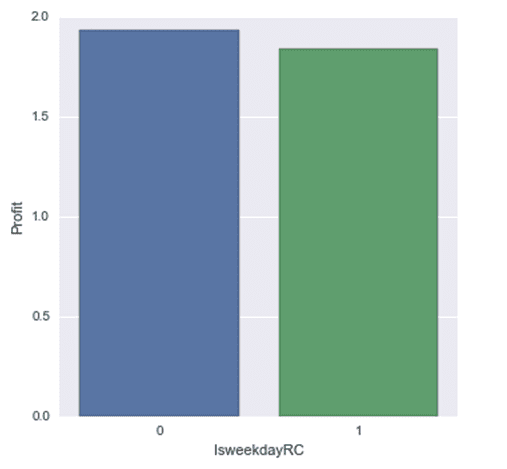
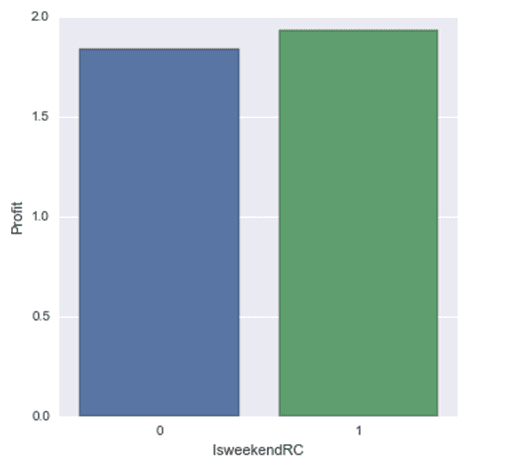
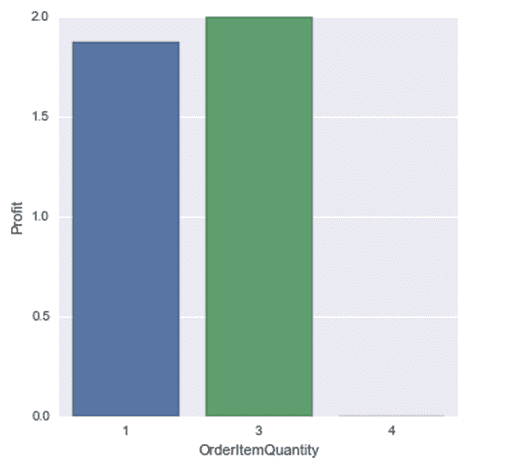
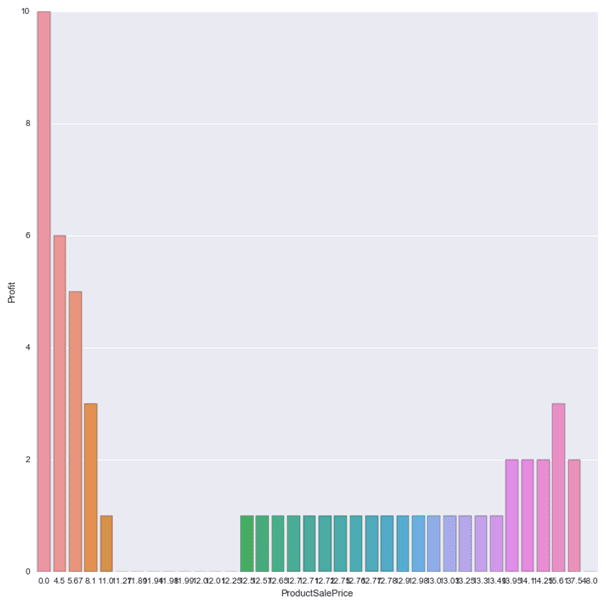

Table 2 below shows the mean, standard deviation and minimum and maximum values for quantitative variables; Product Sale Price, Order Item Quantity, and Supplier Purchase Price
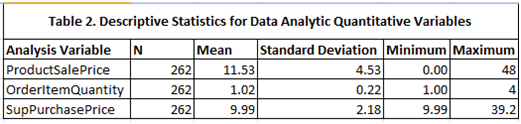
Fig 1 belows shows the Scatter plot that was generated for the relationship between the profit and product sale price. The relation was curvy in nature as can be seen below:
Fig1
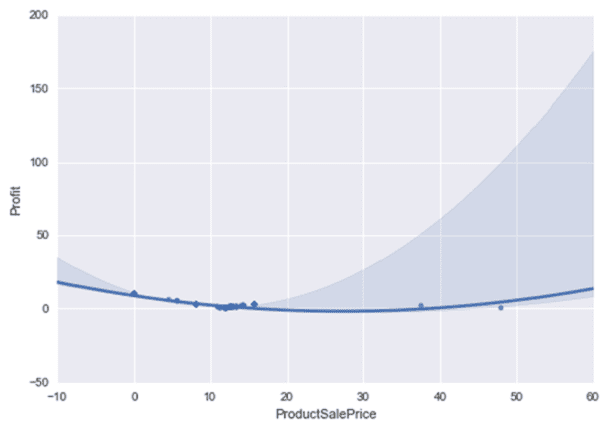
so Ordinary Least Square (OLS) regression was used to test the relationship between the 2 variables after centering the product sale price variable.
With the OLS result the Product Sale Price had a p-value of 7.39e-32 which indicates the relationship between the profit and product sale price is very significant. However, with R-squared value of 0.412 it means the Product Sale Price only account for 41.2% of the variability in the profit meaning other factors contribute to explaining the variability. However, that is not what I am concerned with at the moment as I only want to determine the optimum price – the price that gives more profit and more sales at the same time. For the same reason, I have not analysed the significance of the relationship between the other quantitative predictor variables Order Item Quantity and Supplier Purchase Price
The Regression Tree that was generated using all the stated predictor variables can be seen in Fig 2 below
Fig 2
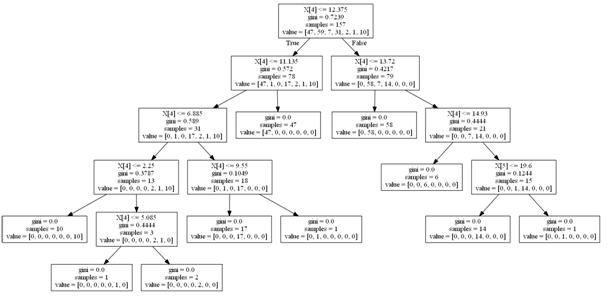
The full and bigger tree can be seen here;
Product Sale Price Regression Tree
As the predictor variables were 7 in total, the first split is on the X[4] which is the index of Product Sale Price in the X-axis (the predictor variables axis). There are 157 data that was included in the regression and on the first split, if the price is <=12.375 the split moves to the left otherwise to the right. The Gini index or co-efficient was used in the regression.
A Confusion Matrix was used to estimate the prediction accuracy of my model.
Fig 3 below shows that the model correctly classified 103 of the observations and only misclassified 2 of the observations.
Fig 3 : Confusion matrix
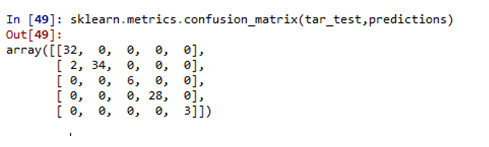
And finally a Test Accuracy score was run to see the model accuracy and it indicated that the model was 0.98095238095238091 (98%) accurate.
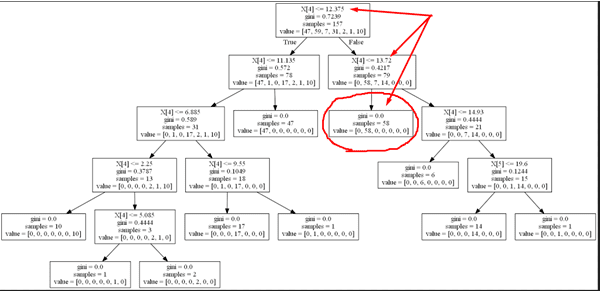
From the regression tree that was generated, it can be seen the optimum price which gives maximum profit and maximum sales is a price which is greater than £12.375 but less than or equal to £13.72 which is depicted in the Fig 4 below. At that price range there was the greater number of times of sales occurred and profit was made, a total of 58 times, where profit was made much higher than any other leaf in the tree.
Fig 4
.
Conclusions/Limitations
This project used Regression Tree to find out what price maximises profit without sacrificing the high sales volume for the product due to the price being too high nor sacrificing the margins on the product due to the price being too low for N = 262 individual orders for Interlocking Hearts Design Cake Knife/Server set from the period ranging from 1st March 2014 to 20th April 2016 with an ecommerce company which sells on Amazon.co.uk
From the results of the Regression Tree, it can be seen that the optimum price which maximises profit without sacrificing the high demand for Interlocking Hearts Design Cake Knife/Server set product is greater than £12.375 but less than or equal to £13.72.
So the company can price the item within that price range. Also from the Is Weekday Histogram, it can be seen that more profit are made when it is not week day. This can also be seen in the Is Weekend histogram. So during weekends the company can price the item much closer to the upper brackets of the optimum price which is £13.72 and during the weekdays price the item much closer to the lower bracket of the price range which is £12.375.
Furthermore from the Is Bank Holiday histogram, it indicates profits are lower during bank holidays so it will be ideal for the company to price towards the lower brackets of the optimum price to increase sales and profit. And from the Order Item Quantity histogram it indicated profits were higher when the item was bought in quantity of 3. Hence the company can consider doing bundling of items, that is, sell 3 in one pack to customers instead of selling it in single pieces so as to maximise profit.
This project successfully developed a predictive algorithm for the optimum price that appears to have little bias and variance. In addition, it provides more information on which particular days of the week or period are most likely to have an impact on the profit and total sales. However, there are some limitations that should be taken into account when considering pricing based on the results of this project. First, profits should only be positive profits as we are only looking at price that will give profit. The project did not deal with loss figures. Hence the profit figures should all be positive so as to get the best price. No consideration was made for other external costs that can influence profit as in warehousing, staff, electricity and other costs. All these were held constant. A consideration of these amongst other variable might will enhance the algorithm
The dataset is relatively small as it is from a small ecommerce company hence future testing of the model should be made on larger dataset that has thousands and millions of transactions for each product. The significance of other variables must also be checked in future algorithms to also know what effect they have on the price and also which other variables will be confounded.
Full Python Code can be found on my Github page : Click here
%20–%20Machine%20Learning)